
Perfmon: The Poor Man's SQL Server Performance Monitoring Pt. 1/2
Baseline SQL Server performance on Windows Server using Perfmon

Every self respecting DBA knows how to baseline their database performance.
An advantage of using SQL Server on a Windows machine is being able to use just one tool, Perfmon, to measure performance for both the server layer as well as the database layer.
Tight coupling between layers this way is normally frowned up in the software world, but it does have its advantages when it comes to simplicity.
So in this 2 part blog series I’ll be showing you both how to setup Perfmon as well as how to analyze its output.
Below are the steps necessary to set up Perfmon:
Search for “Perfmon” on the Windows search box, remembering to open it in administrator mode.

At this point point you will be asked to enter the username and password for the admin user account.

Once perfmon is open, we will need to create what’s called a new “Data Collector Set”.
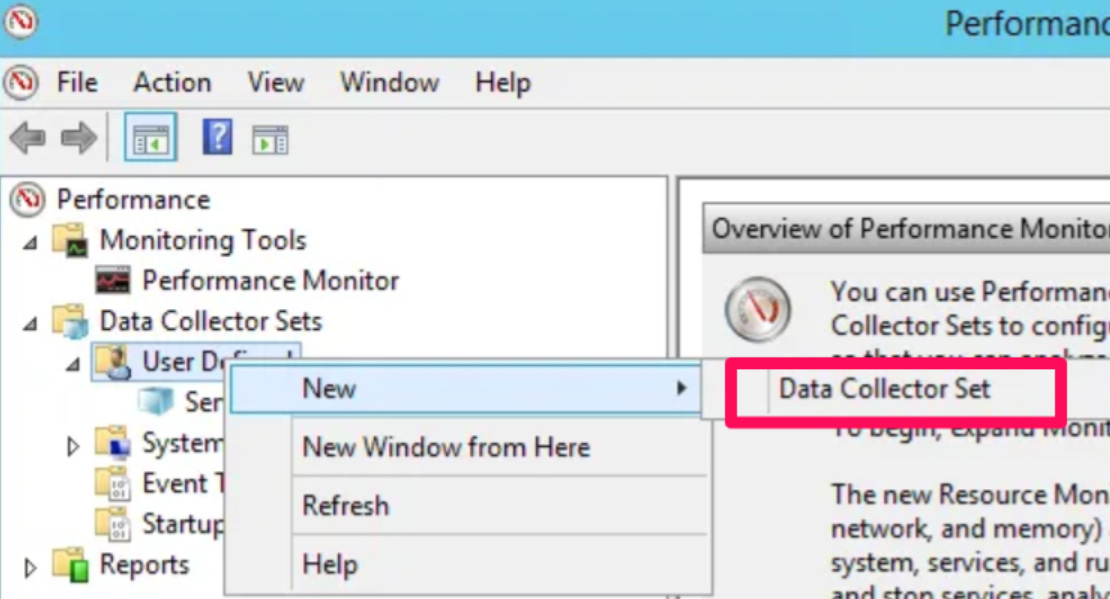
Give whatever name your little heart desires to your “Data Collector Set”, select “Create manually” and hit Next.

Select “Performance Counter” and hit next

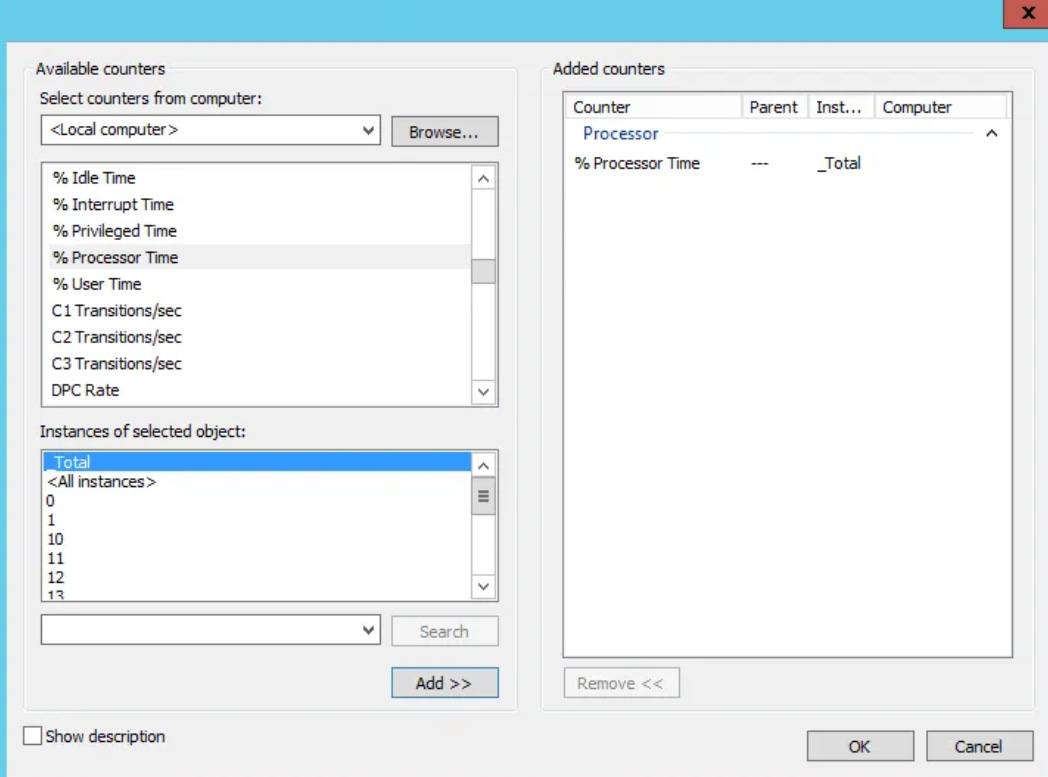
Now for the good stuff. This is the step where we select what counters we want. You’ll notice from the screenshot below that we have different categories like “Processor” and “RAS”. Within each category you’ll find different counters you can set up for that specific category.

You can spend a lifetime learning about all the different perfmon counters you can setup, but the only ones I ever care about are the counters that let me measure CPU, IO and Memory.
Under the Processor category select “% Processor Time” and hit the “Add »” button.
You’ll also notice a checkbox that reads “Show Description”. Once you have a counter selected, you can read about what that counter does by checking the “Show Description” checkbox.

Repeat step 6 for all the other counters. All the counters we need and the categories inside of which they are found is listed in the snapshot below.
Keep in mind that some counters can be setup more than once. For example, if you’re measuring “Transaction/sec”, you can set that counter up for each individual database running on a SQL Server instance.
Below you’ll notice that I’ve setup the counter “Avg. Disk/Read” for both the F: drive as well as the D: drive.

Once you hit ok, set the “Sample interval” time to 1 minute and click on Next. This configures your counters to measure performance every 1 minute and write its output to a CSV file every 1 minute. But don’t let this worry you as it would take a lifetime for the CSV files to use up any significant disk space.

Here we specify which folder we want the CSV output files to live in. Select your folder and hit Next

Select “Save and close” and click Finish.


If you made it this far I’d like you to congratulate yourself because we are 95% done. Even though our Perfmon counters are technically ready to begin monitoring, we have a couple more configurations to setup before we can start the counters.
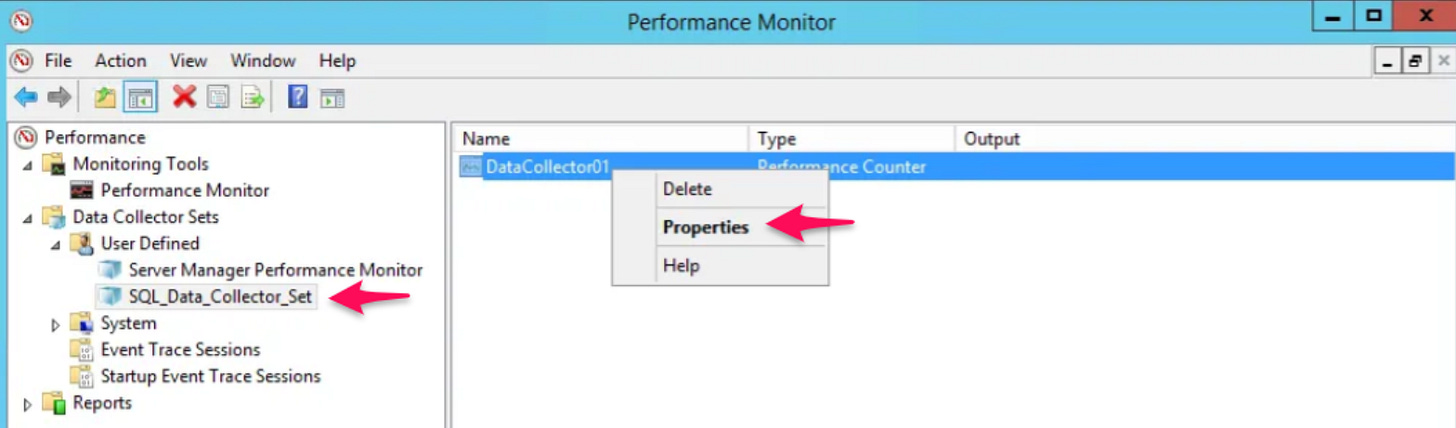
Back at the Perfmon home screen, select the Data Collector Set you just created (“SQL_Data_Collector_Set” in my case), and then right click on the “DataCollector01” line and select properties
Select “Comma Separated” in the log format and make sure the “sample interval” time is set to 1 minute. Click Apply and then select the File tab at the top of the window.

Specify a log file name and the file name format. Just write down whatever I have listed below to keep things simple. When Perfmon generates CSV output files, the name of the CSV file will be a concatenation of the “Log file name” and “File name format”. The file name format “yyyyMMdd” will translate to the the year, month and day of whichever day the CSV output file was generated.

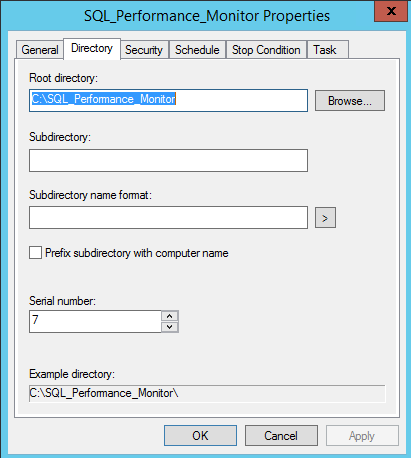
Once you click apply and ok, you’ll be back at the Perfmon main window. Here we will right click on the User Defined Data Collector Set (in my case, “SQL_Performance_Monitor”) and click Properties

In the “Directory” tab of the window that opens, confirm the location of the CSV file output location for your counters

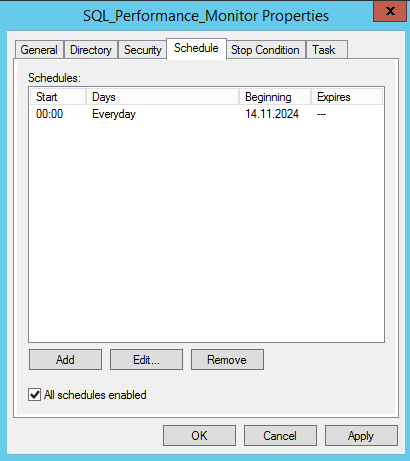
Under the “Schedule” tab, add a new schedule where the counter begins everyday at midnight.

Step 16 enables are counter at midnight everyday. In the next step (Step 17), we’re going to STOP our counter at the end of each day. This way, a new CSV output file is created for each new day.
Under the “Step Condition” tab, specify under what conditions your counter will stop. I configured mine to stop after 1439 minutes, which is just under 24 hours because I want a new CSV output file generated for each new day.
Another stop condition is if the size of a single day’s CSV file excess 1025 MB, but this will honestly never happen).


Click Apply and OK.
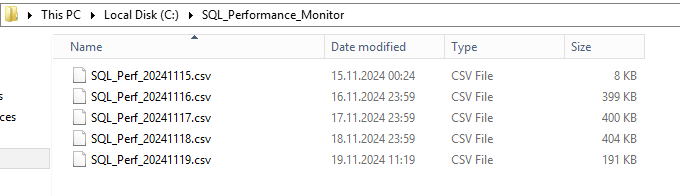
At this point your counters are ready and at midnight will automatically begin on their own. The counter will monitor the system/database every minute and log to a CSV file which we specified the location to be C:\SQL_Performance_Monitor.
You know the the counters have successfully started running at midnight if you see a green play button next to the Data Collector Set.

Here’s what the CSV destination folder will look like after the counter has run for 5 days:
Once you’ve let your counter run for a couple days you’ll be ready to start analyzing its output and baseline your server and database performance. In part 2 of this blog post I’ll be showing you how to do just that, along with how to transfer Data Collector Sets from one machine to another; this way you’re not creating performance counters from scratch every time you start working with a new server.